 Hon. Jim McGinty [1949 ONE VOTE ONE VALUE ACT 2005Electoral reform legislation was signed into law by the State Governor on Monday 23rd May, 2005. This meant that beginning with the State election [due February 2009 but held 6th Sept 2008], most voters in WA voted in electorates of equal enrolment for the Legislative Assembly (LA), where the Government is formed. This is a great achievement for the people of Western Australia, the Gallop Labor Government, and especially for the Attorney General, Jim McGinty. After many years of struggling with the Upper House and losing legal battles, Jim McGinty gained the vote of an Independent [formerly Liberal], Hon Alan Cadby, and together with the Greens, guided through this significant reform. |
Electoral Amendment Act 2005Table 1 compares structural outlines | ||
| House of Parliament | Old system [applied up to State general election on 6th Sept 2008] |
Reformed new system |
| ASSEMBLY |
|
|
| COUNCIL |
|
|
| LAW |
|
|
| * Enrolments at 26th February 2007 | ||
Table 2 - 2005 reformComparison between the old and the new electoral systemMalapportionment among enrolments in the new regions for Legislative Council elections show imbalances as large as those in the system being replaced but the boundaries of the old system have existed since 1998. Growth in enrolments has accumulated significant distortions in the old regions and this effect is likely to continue. Key Significant improvement Minimal or no changeEnrolments at 26th February 2007 |
|||
Comparison |
Old |
New |
|
Legislative |
Metro enrolment Country enrolment Metro districts Country districts |
74.3% 25.7% 59.6% [34] 40.4% [23] |
No change No change 71.2% [42] 28.8% [17] |
| LA Average enrolments |
Metro districts Country districts Ratio between Metro and Country |
27,978 14,092 1.95:1 |
22,275 19,066 1.17:1 |
| LA enrolments Highest district Lowest district |
Percentage above State average Percentage below State average |
+66.4% Wanneroo -45.8% Kalgoorlie |
+8.4% Cottesloe -47.1% Pilbara |
| LA enrolments | Ratio between highest and lowest district enrolment | 3:1 | 2.0:1 |
Legislative |
Metro enrolment Country enrolment Metro seats Country seats |
74.3% 25.7% 50% [17] 50% [17] |
No change No change 50% [18] 50% [18] |
| LC Average enrolments per MLC |
Metro regions Country regions Ratio between Metro and Country |
55,031 19066 2.88:1 |
51,974 18,007 2.88:1 No change |
| LC enrolments Highest region Lowest region |
Percentage above State average Percentage below State average |
+50.6% North Metro -65.2% Mining & Pastoral |
+48.8% North Metro -64.8% Mining & Pastoral |
| LC enrolments | Ratio between highest and lowest region enrolment | 4.3:1 | 4.2:1 |
| Control of Parliament | Majority of MsLA in lowest enrolment districts Majority of MsLC in lowest enrolment regions |
37.7% [29/57] 30.0% [18/34] |
48.0% [30/59] 29.8% [19/36] |
New system - 2007The table below summarises the structure which was finalised by the Electoral Distribution Commissioners on 29th October 2007.In the table enrolments are based on the average within each region. Two districts will be added to the LA to make 59 and two seats will be added to the Legislative Council (LC) to make 36. Inequalities in the previous system required country LA districts to have around 14,000 electors but city districts to have around 27,500 electors. Removal of most of these inequalities will lead to fewer districts in the country and additional districts in the metro area. |
|||||
| Council | Assembly | ||||
| Region | MLCs 36 |
Region enrolment |
Enrolment per MLC |
MLAs 59 |
Average enrolment per MLA/district |
| Mining & Pastoral | 6 | 73,776 | 12,296 | 5 # | 14,755 |
| Agricultural | 6 | 82,479 | 13,746 | 4 | 20,620 |
| South West | 6 | 167,871 | 27,978 | 8 | 20,984 |
| East Metro | 6 | 311,378 | 51,896 | 14 * | 22,241 |
| North Metro | 6 | 312,587 | 52,096 | 14 * | 22,327 |
| South Metro | 6 | 311,583 | 51,930 | 14 * | 22,256 |
# If a district exceeds 100,000 square kms in area at the time of a redistribution, a number equal to 1.5% of its area will be added to artificially increase the number of electors so that the total may fall within a tolerance from 20% below to 10% above the State average district enrolment. In the 2007 redistribution the large district allowance has reduced the enrolment in 5 districts in the Mining and Pastoral region by 34,209. [This table quotes only real electors.] Most districts are not affected by this large district allowance and their enrolments are set within a tolerance from 10% below to 10% above the State average district enrolment i.e. 21,350. * The Act requires approximately the same number of districts in each of the 3 metropolitan regions but gives no similar instruction for the 3 country regions. State enrolment on 26th February 2007 was used to create the new boundaries. The quota of votes to elect a Member to the Legislative Council is 14.29% when 6 are to be elected. | |||||
TWO STEPS FORWARD, ONE BACK IN 2005Legislation passed on 23rd May 2005 brought about a redistribution of State Parliamentary electoral boundaries in 2007 in preparation for the election due in 2009 but held 2008. |
|
These reforms are by no means comprehensive. In regard to the LA, the Government was constrained by an election promise to preserve five districts in the Mining and Pastoral Region, covering most of the remote areas of the state. In the rules for redistribution of boundaries in some LA districts, square kilometres will be equated with electors, which will produce districts with well below average enrolment, some more than 9,000 electors below [See the tables below]. This means that one vote, one value is not applied in the Mining and Pastoral region. This takes the edge off reform and leaves ground for further reform. The biggest problems are with the Legislative Council (LC), which remains unreformed and undemocratic. The Government was forced to conform to Greens policy regarding the LC, as the Greens made their model of the LC a condition of their support for reform. Consequently, there are serious compromises to principles of democratic representation in Parliament. Firstly, the LC will continue to have extremes of vote weighting of more than 4 : 1 between metropolitan and rural voters. Under the previous system there were 17 MLCs representing 74% of electors in metropolitan regions, and 17 MLCs representing 26% of electors in country regions. It seems unconscionable to ignore such large inequalities, but that is what the new law does by the addition of one MLC to either side of the country/metro allocation to make it 18/18 (six regions, each with six members). This is a serious flaw, and does nothing to address the existing imbalance in representation. The second flaw is no less serious, and has the potential to result in an inaccurate reflection of voters' wishes. In order to win a seat when six are to be elected by proportional representation from a region an MLC must obtain 14.3% of the vote. It will be highly unlikely for a party to win a majority (ie. four out of six members in a region) as they would have to obtain 57.2% of the vote. The problem lies with the even number of seats. Under proportional repsesentation the election of an uneven number of representatives from each region will more accurately reflect the votes cast, a principal which applied under the previous system. Under the system insisted on by the Greens it will be possible for 57% to vote for party A and 43% to vote for party B - a clear decision by voters - and yet each party would win three seats from that region. Thus, winning the vote may not translate into winning the election. [See note below about Senate elections] |
"All animals are equal
but some animals
are more equal than others"
George Orwell, 1945
Greens' electoral model flawedNotes contributed in 2005 by the late Gordon Payne [1942-2025] a consistent campaigner for one vote one value.In a media release on 26th April, 2005, the Greens Party called for support for their Electoral Reform Model for the LC. The Greens may call their model "country-friendly" but it is certainly not "people-friendly". The Greens seem to have forgotten that in a democracy, Parliament is about representing people, not acres, trees, or anything else. Those concepts belong to the 19th century, when only men with property could vote. The Greens' model, now entrenched in legislation, sets up 6 regions each electing 6 members by proportional representation (PR). Three regions cover the metropolitan area which contains 935,539 electors, and the other three regions containing 324,126 electors cover the SW, Agricultural, and Mining and Pastoral areas. There is an imbalance of 2.88 : 1 between the average number of people represented by a metropolitan and a rural Member of the LC. In the worst case this imbalance is more than 4 : 1. This is significantly worse than the weighting in the compromise model for the LC proposed by the Government. The Government model proposed 3 regions of 7 members each for the metro area, and 3 regions of 5 for the rural areas. Adoption of this model would have reduced vote weighting and preserved the momentum for electoral reform in State Parliament. Democracy begins by giving everyone a vote, but it is measured by how fairly those votes are counted. The Greens' model fails to reform the WA Parliament, and must be a huge disappointment to Greens supporters. These are the difficulties and objections to their model:
The opportunity to reform the WA Parliament does not come very often - the last significant reform was in 1987 by a Labor Government and it lead to representation in the LC for the Democrats and the Greens. And we still have a long way to go. It is critical that each step forward be guided by democratic principles, and that all steps lead to a better Parliament. The Greens' weighted vote model for the LC is a step backward for electoral reform in WA. Why we elect 6 Senators |
Legislative Council election results 2008 | ||||
| region/party | ALP | LIB | GRN | NP |
| Agricultural | 1 | 2 | 3 | |
| Mining &Pastoral | 2 | 2 | 1 | 1 |
| South West | 2 | 3 | 1 | |
| East Metro | 2 | 3 | 1 | |
| North Metro | 2 | 3 | 1 | |
| South Metro | 2 | 3 | 1 | |
| Totals [ 36] | 11 | 16 | 4 | 5 |
System prior to 2005 - the reasons for reform |
Enrolments in the old system. This structure applied from the 1987 reform until the election held on 6th Sept 2008. |
||||
| ASSEMBLY | COUNCIL | |||
| District [1 MLA each] |
District enrolment | Region | Region enrolment | Enrolment per MLC |
| Armadale Ballajura Bassendean Belmont Darling Range Kenwick Midland Serpentine-Jarrahdale Southern River Swan Hills |
27,680 26,653 26,622 26,911 29,369 26,464 25,882 29,945 28,117 28,167 |
East Metropolitan 5 MsLC 10 districts |
275,810 | 55,162 |
|
Balcatta Carine Churchlands Cottesloe Girrawheen Hillarys Joondalup Kingsley Maylands Mindarie Nedlands Perth Wanneroo Yokine |
28,382 27,927 27,351 27,599 25,206 27,497 25,582 26,977 27,816 25,240 28,208 27,784 36,769 28,248 |
North Metropolitan 7 MsLC 14 districts |
390,586 | 55,798 |
|
Alfred Cove Cockburn Fremantle Murdoch Peel Riverton Rockingham South Perth Victoria Park Willagee |
27,906 28,263 26,215 28,005 28,736 27,349 25,098 27,464 24,914 25,193 |
South Metropolitan 5 MsLC 10 districts |
269,143 | 53,829 |
| Metropolitan total Metropolitan average |
935,539 27,516 |
|||
|
Avon Geraldton Greenough Merredin Moore Roe Wagin |
13,490 13,698 13,689 13,233 13,395 13,124 13,257 |
Agricultural 5 MsLC 7 districts |
93,886 | 18,777 |
|
Central Kimberley-Pilbara Kalgoorlie Kimberley Murchison-Eyre North West Coastal |
12,219 11,973 13,056 13,228 13,956 |
Mining & Pastoral 5 MsLC 5 districts |
64,432 | 12,886 |
|
Albany Bunbury Capel Collie-Wellington Dawesville Leschenault Mandurah Murray Stirling Vasse Warren-Blackwood |
14,404 14,409 16,242 15,191 16,557 14,362 14,571 15,390 14,660 14,381 15,641 |
South West 7 MsLC 11 districts |
165,808 | 23,687 |
| Country total Country average |
324,126 14,092 |
|||
| State total State average |
1,259,665 22,099 |
|||
| A tolerance of plus or minus 1.5% is permitted at a redistribution from the average district enrolment in the country and from the average district enrolment in the metropolitan area. The quota of votes to elect a Member to the Legislative Council is 16.7% when 5 are to be elected and 12.5% when 7 are to be elected. | ||||
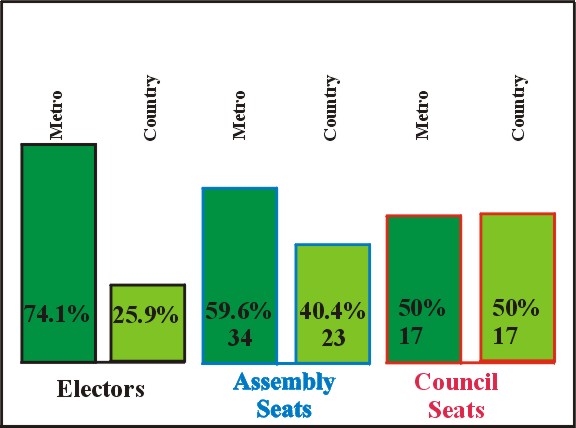
| Citizens do not have equal political influence | |||
| Area | Enrolments | Assembly seats | Council seats |
| Metro | 74.2% | 59.6% [34] | 50% [17] |
| Country | 25.8% | 40.4% [23] | 50% [17] |
| State | 100% | [57] | [34] |
Inequality among electors in Assembly districts
| Average enrolments | ||
| Metro area | 27,516 | Metro : Country ratio 1.95 : 1 |
| Country area | 14,092 | |
| Percentages above or below State average district enrolment of 22,099 | ||
| Highest district Lowest district |
Wanneroo Kalgoorlie |
+66.4% -45.8% |
| For the Commonwealth House of Representatives and most State Parliaments, electorate enrolments may vary by only 10% from the average | ||
Inequality among electors in Council regions
| Average enrolments | ||
| Metro area | 55,031 | Metro : Country ratio 2.88 : 1 |
| Country area | 19,066 | |
| Percentages above or below State average region enrolment per Member of 37,049 | ||
| Highest region Lowest region |
North Metropolitan Mining & Pastoral |
+50.6% -65.2% |
Other facts
|
| Return to the top of this page. | Built using HTML-Kit | Hosted by  |
| Web page created by Graham Hawkes. | ||