ELECTORAL INEQUALITY
These web pages are a "for the record" outline at the end of the long, almost 50 years, often controversial, frequently disappointing, sometimes exciting, peaceful and always determined efforts by the Australian Labor Party to create a fair system in which voters have an equal say in choosing our representatives in the WA Parliament.
The pattern of malapportioned enrolments below is historical from the creation of the State Parliament in 1890.
Enrolments from the election of 1986 are illustrative.
The pattern was also the central reason the Liberal and National Parties and their predecessors maintained an unbroken majority in the Legislative Council [LC] from 1890 to 1992, over 100 years.
The Liberal Party has always opposed one vote, one value and since the reform in 2021 which ended vote weighting has said it will it bring back.
Contents on the left link to steps toward reform, statistics, related information and an overview of history.
Moral, philosophical and social reasons
| WHY VOTES SHOULD BE EQUAL |
|
EQUAL DIGNITY |
Over and under representation.
| Citizens do not have equal political influence [Enrolment statistics for State election 8th Feb 1986] | |||
| Area | Enrolments | Assembly seats | Council seats |
| Metro | 77.5% | 52.6% [30] | 41.2% [14] |
| Country | 22.4% | 47.4% [27] | 58.8% [20] |
| State | 100% | [57] | [34] |
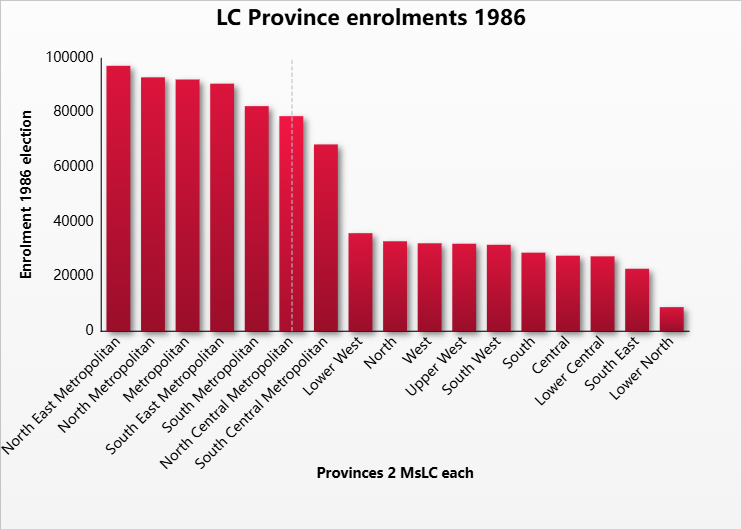
| Inequality among electors in Council Provinces [Enrolment statistics for State election 8th Feb 1986] |
|
|
|
| Metro Provinces average per Member 48 621 | Average Metro : Country Province ratio 3.4 : 1 |
| Country Provinces average per Member 14 017 | |
| Percentages above or below State average Province enrolment per Member of 22 861 | Highest Province North East Metropolitan +112.7% Lowest Province Lower North -80.7% Ratio between highest and lowest 11 : 1 |
| Inequality among electors in Assembly districts [Enrolment statistics for State election 8th Feb 1986] |
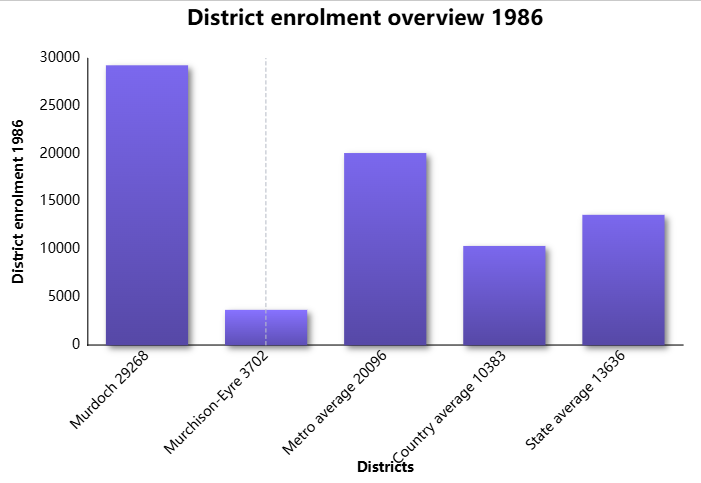 |
| For the Commonwealth House of Representatives and most State Parliaments, electorate enrolments may vary by only 10% from the average. | |
| Percentages above or below State average district enrolment of 13 636 | Highest district - Murdoch = +114.6% Lowest district Murchison-Eyre = -72.8% Ratio between highest and lowest = 7.9 : 1 |
| Enrolments for 8th Feb 1986 State election | ||||
| Districts | District enrolment | PROVINCE | Province enrolment | MsLC 1 each election |
| METROPOLITAN AREA [Average Province enrolment = 86 127] | ||||
| Cottetsloe Floreat Nedlands Perth Subiaco | 18 602 19 762 17 501 18 248 18 114 | Metropolitan | 92,227 | 2 |
| Balcatta Balga Nollamara Mt Lawley | 20 520 22 603 17 398 18 274 | North Central Metropolitan | 78,795 | 2 | Ascot Helena Maylands Morley-Swan Welshpool | 16 841 21 870 17 887 22 532 18 113 | North East Metroppolitan | 97,243 | 2 |
| Joondalup Karrinyup Scarborough Whitford | 28 747 21 801 17 856 24 619 | North Metropolitan | 93,023 | 2 |
| Clontarf East Melville South Perth Victoria Park | 16 450 17 569 17 993 16 427 | South Central Metropolitan | 68,439 | 2 |
| Armadale Canning Gosnells Murdoch | 21 266 19 509 20 656 29 268 | South East Metroplitan | 90,699 | 2 |
| Cockburn Fremantle Melville Rockingham | 22 833 17 464 20 272 21 897 | South Metroplitan | 82,466 | 2 |
| Totals | 602,892 | 30 | 602,892 | 14 |
| Metro district average | 20 096 | |||
| AGRICULTURAL, MINING AND PASTORAL AREA [Average Province enrolment = 29 822] | ||||
| Avon Merredin Mt Marshall | 9 745 9 074 8 851 | Central | 27,670 | 2 |
| Collie Warren? Narrogin | 9 410 8 758 9 258 | Lower Central | 27,426 | 2 |
| Dale Mandurah Murray-Wellington | 12 289 12 390 11 234 | Lower West | 35,913 | 2 |
| Albany Katanning Roe Stirling | 9 212 9 557 10 002 | South | 28,771 | 2 |
| Esperance-Dundas Kalgoorlie | 11 694 11 182 | South East | 22,876 | 2 |
| Bunbury Mitchell Vasse | 9 202 11 636 10 820 | South West | 31,658 | 2 |
| Geraldton Greenough Moore | 10 396 10 235 11 419 | Upper West | 32,050 | 2 |
| Darling Range Kalamunda Mundaring | 10 871 10 486 10 859 | West | 32,216 | 2 |
| Totals | 238,580 | 23 | 238,580 | 16 |
| A,M &P district average | 10 373 | |||
| NORTH-WEST MURCHISON-EYRE AREA [Average Province enrolment = 20 883] | ||||
| Gascoyne Murchison-Eyre | 5,113 3,702 | Lower North | 8,815 | 2 |
| Kimberley Pilbara | 17,918 15,034 | North | 32.952 | 2 |
| Totals | 41 767 | 4 | 41 767 | 4 |
| N-W-M-E district average | 10 442 | |||
| Overall averages | 13 636 | 45 722 | ||
| Overall total 57 | 777283 | 57 | 34 | |
Parliament [ i.e. Liberal/National Parties] drew the Metropolitan Area boundary, the boundaries of the 4 North-West-Murchison-Eyre Area districts and prescribed malapportioned ratios of enrolment between Metro and AMP country areas. | ||||
| Other facts | |||||||||||||||||||||||||||||||||||||||||||||||||||||||||||||||||||||||||||||||||||||||||||
| |||||||||||||||||||||||||||||||||||||||||||||||||||||||||||||||||||||||||||||||||||||||||||
|
 |
||||||||||||||||||||||||||||||||||||||||||||||||||||||||||||||||||||||||||||||||||||||||||
